Chapter 01 Understanding Dams
Chapter 01 introduces key ecological, social, infrastructural, and economic factors that are important to consider for the management of dams at the individual and watershed scale.
1.1
Types, Uses, Ownership
Dam Types
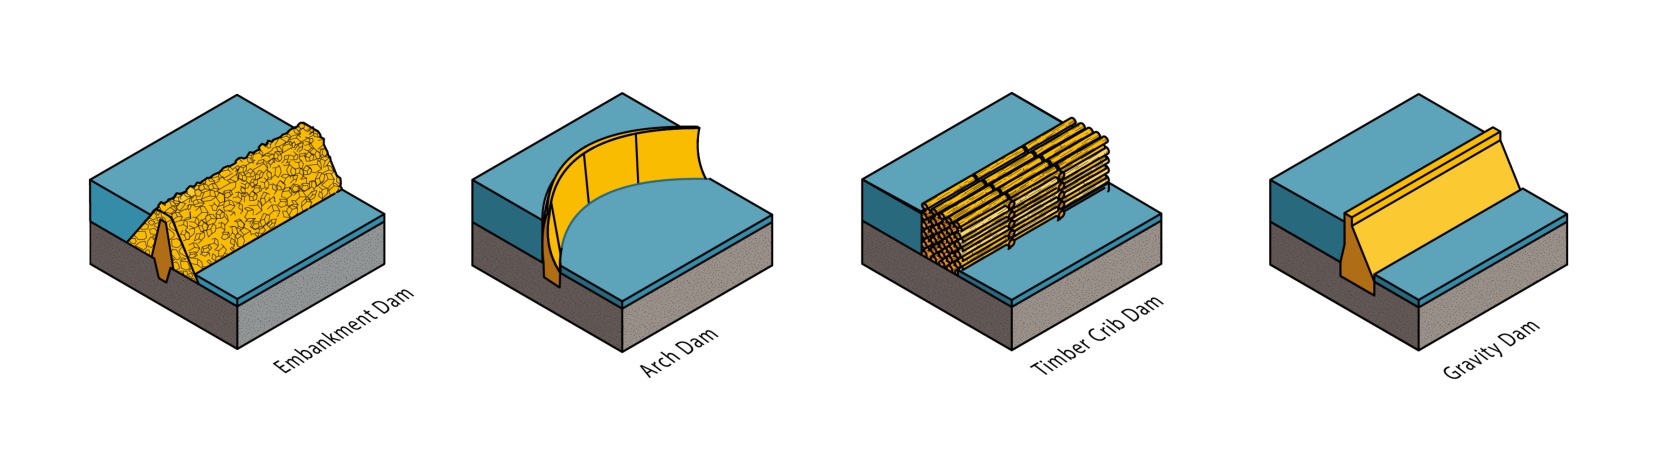
Depending on the size, age, and purpose of a dam, a range of construction materials and methods may have been used in the original construction. Some common materials used to construct dams include earth, timber, stone, concrete, and masonry. Embankment dams are made of compacted earth (“earthfill”) or rock (“rockfill”). Concrete and masonry dams are categorized as gravity or arch dams. Gravity dams hold back water using only the weight of the construction material. Arch dams are built of thin concrete walls, and the force of the impoundment water is borne by the abutments on the side of the dam. Some historic dams within Narragansett Bay and the coastal watersheds of Rhode Island were originally timber crib dams that were constructed of heavy timbers cross stacked like log houses and filled with boulders. Most of the timber crib dams were later rebuilt with concrete and stone, or a new dam was built immediately downstream of the older legacy dam. Many older dams are composed of a combination of materials added as repairs were made to the structure over the years.
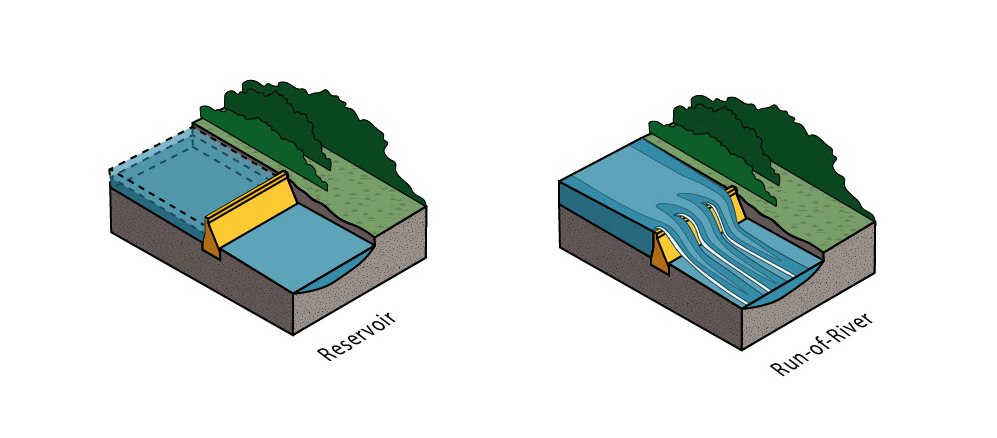
Dams operate in a range of ways depending on their intended purpose. Two common types of dams are run-of-river dams and detention dams, also known as storage dams. The vast majority of the dams in Narragansett Bay and corresponding coastal watersheds are run-of-river dams. Run-of-river dams have low water storage capacity and little impact on the water flowing over a dam. Unlike flood control dams, where water can be released depending on the season or in anticipation of a storm, run-of-river dams provide minimal control over how much water spills over the dam or is held behind the dam. Thus, water levels on either side of a run-of-river dam scarcely fluctuate; the amount of water that flows over the dam is essentially equivalent to the amount that would be present without the dam. Detention or storage dams create large impoundments that store water, and they are built with operational controls so that an operator can determine how much water is diverted for use, how much water is stored in the reservoir, and how much water goes downstream. Detention dams are often constructed to serve a specific purpose, such as municipal water supply, irrigation, or hydroelectric power. Flood control dams are a form of detention dam with the capacity to temporarily hold large volumes of water during flood conditions.
Dam Ownership
Unlike the large, federally owned dams in the Western and Southeastern United States, most dams in New England were constructed by private individuals and companies to power mills, and many are still privately owned. Within the Narragansett Bay and associated coastal watersheds, records from state regulatory authorities show that 345 dams (34%) are privately owned, 308 dams (30%) are publicly owned, and 377 dams (36%) have unknown private owners and are commonly considered “abandoned”. Typically, when a property with a dam is sold, the ownership and responsibility for the dam is transferred to the new owner. While some landowners may appreciate having a dam on their property, it is also a liability. Dam owners are responsible for the safe operation of the dam and may be liable for injuries or damages due to any accidents or failures of the dam. Furthermore, dam owners incur the costs of regular maintenance and repairs, as well as the acquisition of any necessary licenses or state-required inspections. The 377 dams whose owners are unknown provide a unique challenge for regulating authorities, as many of these dams are in need of repair and the responsible party is not clearly defined. Since many of these dams are more than a century old, ownership information may have been lost or forgotten over the years.
Even though the majority of legacy dams are privately owned, dams are a public issue. Dams impact the health of rivers, which are a public resource, and if not properly maintained, dams can pose significant threats to downstream communities. Although the dam owner is the ultimate decision maker and is responsible for costs associated with the dam, the cost of repairs or removal can amount to hundreds of thousands of dollars, far exceeding the financial ability of most private owners. There are no other examples of such widespread infrastructure being privately owned in the United States.
Ownership of Dams in the Narragansett Bay Watershed
Dam Uses
The majority of dams in the Narragansett Bay and associated coastal watersheds were built for small-scale, localized production of kinetic power but are now functionally obsolete and do not serve any purpose. Many historic dams have been adapted to serve other functions including recreation, small-scale hydroelectric power generation, agricultural water supply, and fire protection.
Sixty-Nine dams within the study area are listed as providing municipal water supply. Two of the larger water supply systems within the watersheds are the Scituate Reservoir that provides drinking water to the Providence metropolitan area and surrounding suburban communities and the Assawompset Pond Complex that provides water for much of southeastern Massachusetts, including to cities of New Bedford and Taunton. Because they are critical infrastructure, it is important that these dams and reservoirs are properly maintained to support these functions.
Dams in the Narragansett Bay Watershed that serve as a water supply
Within the Narragansett Bay and associated coastal watersheds, ten dams (seven in Rhode Island and three in Massachusetts) currently serve as sources of hydropower. Rhode Island hydropower systems generate a total of about 23,000 MWh per year and the state consumes approximately 7,700 GWh of electricity each year2. Therefore, the seven in-state hydropower systems currently supply roughly 0.3% of Rhode Island’s electricity needs. Local electric utilities and the general public are increasingly interested in exploring carbon-free domestic energy sources. Some have advocated that the legacy dam infrastructure in the region be transformed to provide locally distributed energy production. However, given the topography, river size and flow rate, dam size, and available technology, there are severe limits to the amount of electricity that these dams could generate. A hydropower facility that was proposed on a 20-foot-tall dam on the Pawtuxet River would have provided just 0.3 megawatts of power3, while a 70-acre solar power plant proposed for a landfill in East Providence would provide 3.7 megawatts of power4. It is possible that new hydropower technology5 will be more efficient, enabling the distribution of micro-hydropower (generating 5 to 100 kilowatts of electricity) or pico-hydropower (generating less than 5 kilowatts), but seasonal low flows will continue to be a challenge and constrain year-round outputs.
Dams in the Narragansett Bay Watershed used for hydroelectric power
The type, ownership, and use of a dam determine how decisions are made about its future.
1.2
Hazard Risk, Climate Change, Failure
The majority of the dams within the Narragansett Bay and associated coastal watersheds were built over a century ago and are coming to the end of their life cycles. Many dams have not been properly maintained or repaired over the years and if breached would cause significant damage6. State governments classify dams based on the potential impact of dam failure on downstream communities, infrastructure, and structures. Hazard risk does not consider the structural integrity or condition of a dam; it only focuses on potential downstream consequences of dam failure.
There are three hazard rankings commonly used by state agencies:
- High hazard dam: A dam where failure or incorrect operation would result in a probable loss of human life in communities downstream of the dam.
- Significant hazard dam: A dam where failure or incorrect operation would probably not result in loss of human life, but could cause major economic loss, disruption of lifeline facilities, or other impacts detrimental to the public’s health, safety, and/or welfare.
- Low hazard dam: A dam where failure or incorrect operation would probably not result in loss of human life, but could cause low-level economic losses.
Within the Narragansett Bay and coastal watersheds, 55% of the dams do not have hazard data on record. Of the dams that do have hazard rankings within the watersheds, 31% of the dams are classified as high hazard dams, 45% are significant hazard dams, and 23% are low hazard dams.
Energy production in the region is limited by dam size and river flow rate
In both Massachusetts and Rhode Island, regulated dams include dams classified as significant or high hazard; dams classified as low hazard that are six feet or more in height; and dams that have a storage capacity of fifteen acre-feet. (Note: an acre-foot is the volume of water that would cover one acre to a depth of one foot). Dams less than six feet in height are unregulated.
Dams having low, significant, or high hazard risk within Narragansett Bay and coastal watersheds
With the exception of hydropower dams that are regulated by the Federal Energy Regulatory Commission, there is no national standard for inspecting dams. The Department of Conservation and Recreation Office of Dam Safety7 monitors regulated dams in Massachusetts, and the Rhode Island Department of Environmental Management (RIDEM)8 monitors regulated dams in Rhode Island. In both states, an engineer must inspect high hazard dams and report results every two years and inspect and report on significant hazard dams once every five years. In Massachusetts, low hazard dams need to be inspected once every ten years; in Rhode Island, low hazard dams must be inspected once every five years.
When these dam inspections are conducted, the condition of the embankment, spillway, and low-level outlet(s) are rated as good, fair, poor, or unsafe. Following a visual inspection, a dam inspection report is prepared, identifying specific deficiencies and, if warranted, recommending corrective measures. In Massachusetts, owners of dams with deficiencies that are not addressed are fined, adding to the costs of owning a dam. In Rhode Island, as of 2018, 54 high and significant hazard dams were identified as unsafe or potentially unsafe, and their owners had received notice from RIDEM9. By the end of 2018 safety issues at only five of these dams had been addressed. The same year, 31 additional high and significant hazard dams in Rhode Island were identified as unsafe or potentially unsafe, but their owners are unknown and thus could not be notified10. Based on hazard data available for the study area in Massachusetts, there are 52 high hazard potential dams in that portion of the Narragansett Bay watershed. At this time, we do not know how many of those dams are classified as being in poor or unsafe condition.
In addition to inspections, both states expect all dams classified as high and significant hazard to have an Emergency Action Plan (EAP). An EAP is a formal document that identifies potential emergency conditions at a dam and specifies pre-planned actions to be followed during an emergency to minimize loss of life and property damage. The EAP includes an analysis of downstream areas that would be flooded in the event of a dam failure, as well as mechanisms for alerting local emergency agencies and downstream residents if a dam failure is imminent. As of 2018, 31% of high and significant hazard dams in Rhode Island had approved EAPs on record10. At this time, we do not know how many of the high and significant hazard dams in the Massachusetts portion of the study area have approved EAPs on record.
Climate Change
There is a growing risk of dam failure due to the increasing frequency of extreme weather events. Some older dams were built at a time when severe precipitation and peak river discharge were uncommon. In addition, many dams were built when there were fewer established communities living in the flood zones and there were fewer roads, structures, wastewater treatment plants, and other structures and infrastructure downstream of dams.
Age of Dams in the Narragansett Bay and Coastal watersheds
Climate change has altered many aspects of life in the United States, requiring reconsideration of long-established national infrastructure, including dams. With the exception of the small number of dams constructed specifically for flood control, most dams in the Narragansett Bay and associated coastal watersheds do not provide flood control benefits. The risk posed by aging and unmaintained dam infrastructure is exacerbated by increasing annual precipitation along with an increasing frequency of extreme precipitation events. Such events can lead to flooding upstream of a dam and, if a dam fails, can cause extreme and sudden flooding downstream. For example, the 2010 flood in Rhode Island inundated the state with more than 16.34 inches of rain during the month of March, with most of the rainfall occurring in just a few days. This was the highest monthly precipitation on record, and many dams could not handle the excess impounding; several dams within the region failed or were close to failing11. Fortunately, these breaches did not cause any fatalities. In 2023, torrential rains in Central Massachusetts led to concerns that the Barrett Park Pond Dam in Leominster could fail, leading the Massachusetts Emergency Management Agency to issue an evacuation order to residents who lived in low-lying areas. Similar dam failures around the country, including those of the Edenville and Sanford dams in Michigan in 2020, have led to trillions of dollars in damages, and thousands of people whose homes were flood-damaged12.
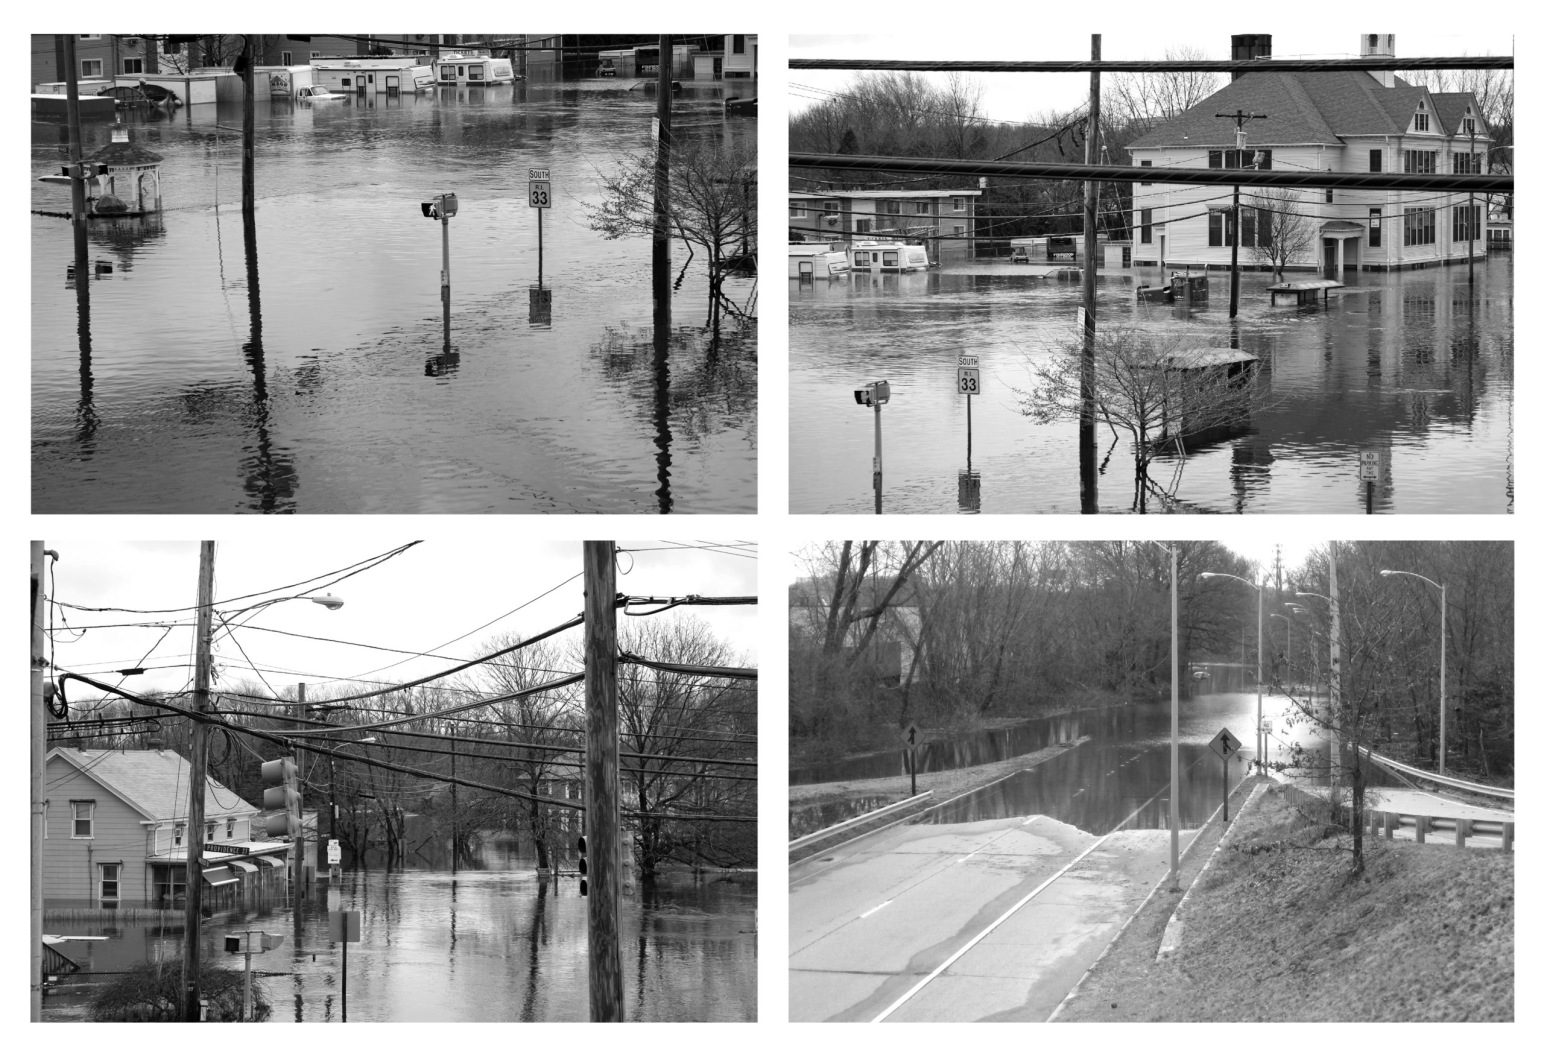
Record Flooding on the Pawtuxet River, March 31, 2010
Photo Source: National Weather Service Northeast River Forecast Center
Dam failure can be catastrophic, leading to loss of life, property, and infrastructure. Dam failure is most frequently caused by water flowing over the top of or routing around the structure; foundation defects such as slope instability and settlement; and internal erosion caused by seepage. Other causes may include structural failure, cracking, and poor maintenance13.
Given the age of dams within the region, the increasing frequency in large storm events, and the potential risk of a dam failure on downstream communities, there is a need to ensure that municipalities have the resources needed to conduct regular inspections. In addition, while it is important that dams have an Emergency Action Plan on file so that communities know how to react when a dam is failing, it is equally important for states and local communities to have adequate funding to support proactive, preventative measures to repair or remove high and significant hazard dams in poor condition.
1.3
Indigenous and Colonial Cultural History
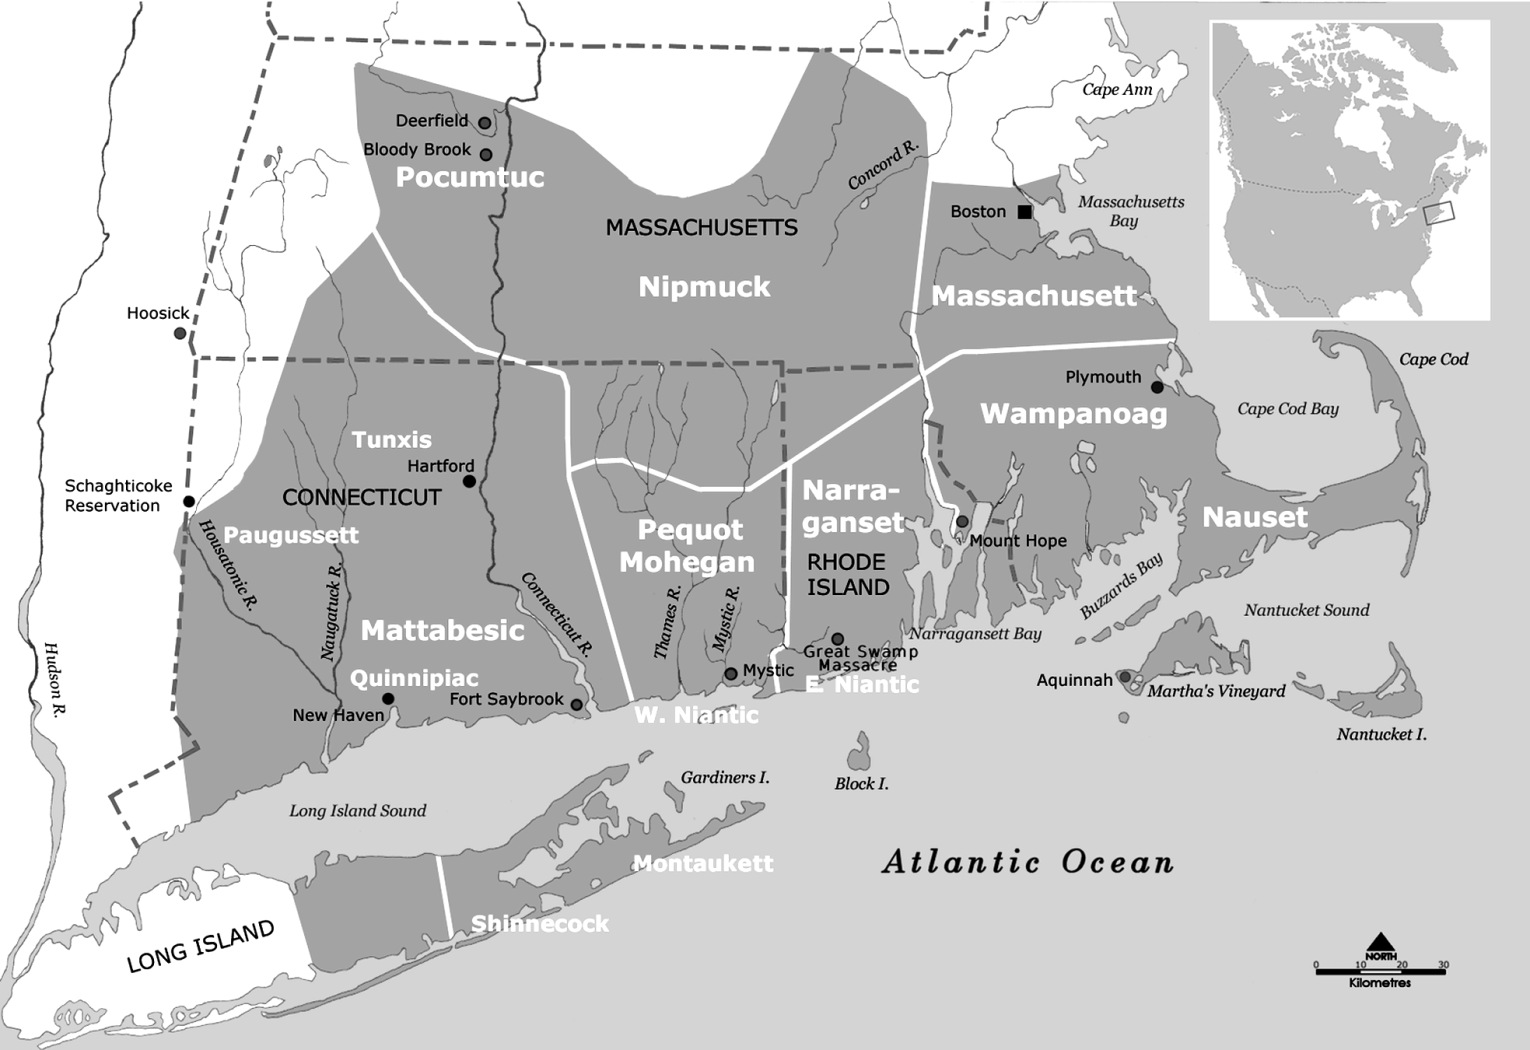
The Narragansett Bay and associated coastal watersheds are the traditional homelands of the Narragansett, Wampanoag, and Nipmuc nations. Discussions surrounding the history of dams and rivers in New England often focus on the dominant colonial and industrial histories of the region. However, Indigenous peoples developed their own distinct relationships with the region’s rivers long before colonial settlement. Tribes of the region relied heavily on rivers for transportation, fishing, and subsistence. Rivers were, and for many continue to be, considered living entities; they are central to the cultural identity, spiritual livelihood, and lifeways, and legacies of Indigenous communities throughout the region.
Indigenous Nations of the Narragansett Bay and Associated Coastal Watersheds
When European colonists first arrived, they found an abundance of migratory fish in the rivers flowing through what came to be called New England. Indigenous communities had long depended on the migration of these fish, which typically coincided with early spring when other food sources were scarce. However, shortly after arrival, the colonists started constructing dams to provide power to mills, often blocking fish migration routes in the process. The impact of dams on fish populations was soon evident to Indigenous communities in the region, who lost a primary food source. This only worsened over time; by the mid-19th century, many migratory fish, such as shad, eel, and river herring, were no longer in abundance within the watersheds of Rhode Island. In addition to the impact of dams on traditional food sources, dams flooded farmland and destroyed gravesites along with other ceremonial and spiritual sites located near rivers.
Rivers are still a crucial part of life for Indigenous communities who live in the region. For some, dams and the diminished migratory fish runs continue to symbolize the injustices of colonization and its lasting impacts on Indigenous cultures, spiritual connections, and relationships between people and rivers within the region.
Colonial History
Colonial settlement of New England was oriented around the region’s rivers. European colonists brought the knowledge and technology to convert energy from the region’s rocky rivers into power for gristmills and sawmills. Slater Mill Dam, constructed on the Blackstone River in 1793, would power the nation’s first textile mill and change the scale and impact of hydropower technology throughout the region. Slater Mill’s success inspired other local entrepreneurs, prompting the rapid increase of hydro-powered mill construction and leading to widespread alterations of the landscapes and watersheds. However, the advancement of steam power technology allowed factories to reduce their reliance on rivers and hydropower and eventually became the dominant source of power in the late 19th century. This led textile production to shift out of New England, impacting local economies and leaving dams as post-industrial relics throughout the region.
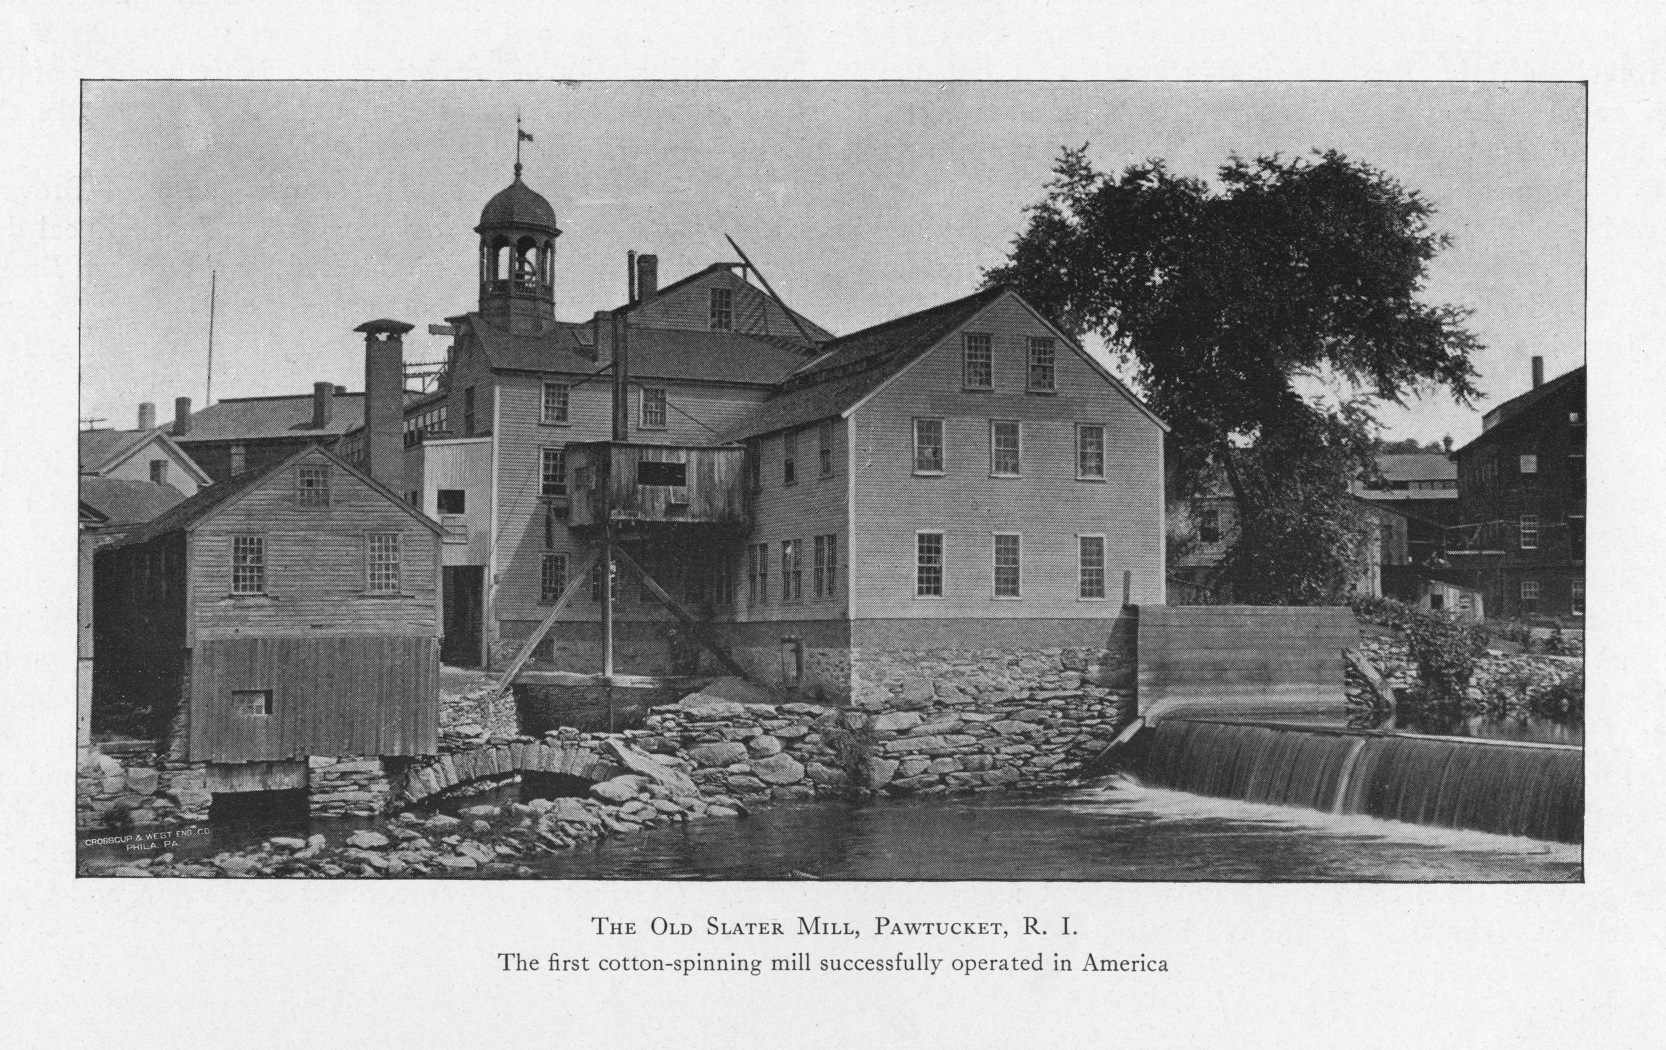
Slater Mill dam; Source: Providence Public Library
As thousands of New England dams approach the end of their life cycles, dam owners and concerned communities must make decisions about the future of their aging dam infrastructure. When making a decision about a dam, there is often the need to balance ecological restoration and public safety with the desire to preserve local history and the unique cultural landscapes of New England14. Some dams, including Slater Mill Dam, are officially listed on the National Register of Historic Places15. This federal register documents properties that are “significant in American history and worthy of preservation.” Section 106 of the National Historic Preservation Act requires federal agencies to follow a review and consultation process to consider the effects of their undertakings on historic properties. As part of this process, a range of alternatives are explored to help avoid, minimize, or mitigate the impacts to historic resources.
Dams within Historic Districts in the Narragansett Bay Watershed
Some dams are not listed on the National Register of Historical Places but hold significance for local communities and are part of the local sense of place and history. According to the World Heritage Convention, cultural landscapes represent the “combined works of nature and of humans. They are illustrative of the evolution of human society and settlement over time.” Dams, associated mill ponds, and old mill structures make up the unique cultural landscape of New England and tell a story of how landscapes and past and present communities are intricately connected in this region.
Photo across Forge Pond on the Westport River with historic mill in the background. Dams and their associated reservoirs and mills are part of the cultural landscapes of New England. Photo by Emily Vogler
In some cases, the historic significance of a dam may lead to a historic dam structure being repaired and maintained. However, for other sites, there may be an opportunity to use design to mark the location of the dam and recognize the multiple histories of the dam and river without preserving the physical dam structure. When a dam removal is planned, historical archaeologists are typically hired to document historical data about the mill, dam, and nearby and regional historical context, features, and other information. These experts participate in site visits during the dam dismantling, recording notes and taking photos of the structures(s) and design features. The results are sometimes used to prepare public signage documenting historical conditions. This work is often required through stipulation in a Memorandum of Agreement among the lead federal agency, supporting agencies, state historic preservation officers, tribal historic preservation officers, and other interested parties.
Refer to the Case Studies section of this document to explore some of the alternatives that can be used to mark, interpret, and adapt historic dam structures to help maintain their sense of place, even if the dam structure is removed.
1.4
Sense of Place + Recreation
Sense of place indicates our emotional connection or attachment to specific places or landscapes. Sense of place often develops over time through personal experience and encompasses a variety of qualities. Social, cultural, ecological, aesthetic, or historical associations all have the ability to create a special relationship between people and their environment. Because it largely develops from experience and perception, sense of place differs for each individual. While one person might have positive memories associated with a specific location, another might experience this same place negatively. Regardless of perception, attachment to a place plays an important part in one’s mental health. It is not unusual for this type of emotional connection to become intertwined with one’s own personal and cultural identity.
Visibility of dams within Narragansett Bay and coastal watersheds
Community sentiment for a dam may vary based on the location, structure, history, family connections, and local uses of the dam and resulting impoundment16. A dam may have been the foundation of a community, used to provide power for a mill by one generation and turned into a tourist attraction for the next, thus becoming an integral part of a community’s identity, sense of place, and pride. In some cases, a community’s attachment may be to the impoundment rather than to the dam itself. The impoundment may be a cherished community swimming hole or a place where generations have grown up fishing. Sometimes, the aesthetics of the dam are valued by the community—the view of the waterfall, the sound of falling water, a visual landmark within the forest. And for some members of the community, a dam may represent historic colonization of the river and the theft of land from Indigenous peoples.
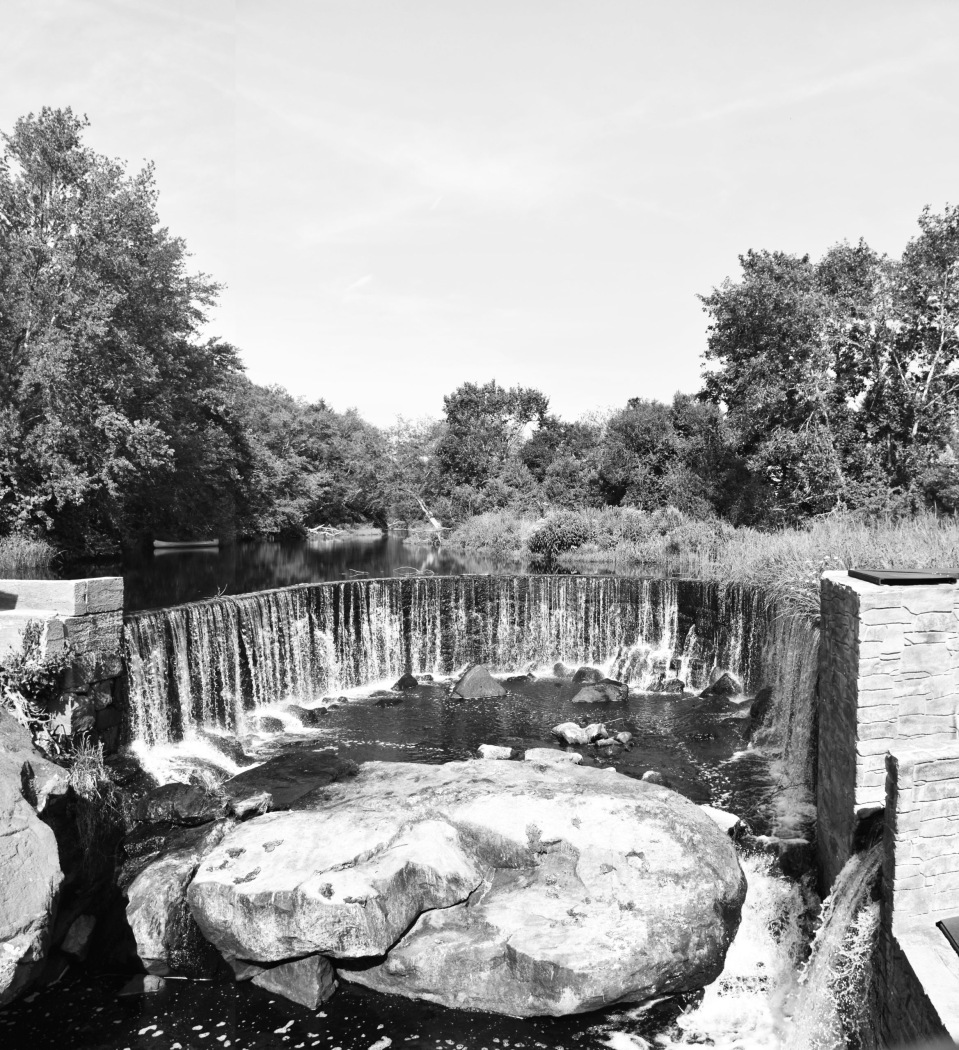
Aesthetics of a dam, Horseshoe Falls
Photo by Emily Vogler
Depending on whether a community’s attachment is to the dam, the impoundment, or a free-flowing river, various future scenarios may be considered. For example, a nature-like fishway can preserve an impoundment while significantly improving fish passage. If open space exists around the dam, a bypass channel can preserve the view of the dam while also significantly improving fish passage and habitat connectivity. In addition, there may be ways to use design to maintain a sense of place and some aesthetic aspects of the dam even if the dam is removed17.
When a community has an attachment to a dam that is privately owned, opportunities for community input may be limited. However, if a dam is publicly owned, the opportunity may exist for the local community to come together to contribute to a decision on the future of the dam. The Decision Making Tools later in this publication can provide guidance on helping communities discuss their local dam to explore what aspects of the dam and surrounding landscape are important to them.
A dam in the middle of a forest may have a different level of attachment than one in the middle of town
Recreation
One of the primary ways that people currently interact with and develop a connection to the region’s rivers is through recreation. Within the Narragansett Bay and associated coastal watersheds, waterways provide an important opportunity for recreation. In addition to the 256 miles of coastline in Narragansett Bay, there are more than 3,000 miles of rivers and streams in the watershed that provide freshwater boating, swimming, and fishing opportunities.
Flowing River Recreation: Rivers within the region are a popular recreational destination for those with kayaks and canoes. Whether day trips or overnight trips, smooth water or rapids, paddlers flock to rivers in the warm months of the year. However, the high number of dams in the watershed and the lack of clear signage and buoys create an obstacle for paddlers traveling downstream on a river. Paddlers have to be knowledgeable about the location of dams and portages. In some places, the portage includes challenging and lengthy traverses across roads and/or carrying the boat up steep embankments. There is also a significant risk that paddlers unaware of a dam’s location can go over the dam, capsize, and potentially drown. The presence and frequency of dams on rivers can prevent paddlers from feeling safe exploring the region’s rivers. In addition to paddling, some of the region’s free-flowing rivers are commonly used for fly-fishing.
Water access points within Narragansett Bay and coastal watersheds. A dam in the middle of a forest may have a different level of attachment than one in the middle of town
Impoundment Recreation: Flat water behind a dam provides a different set of recreational opportunities. Impoundments are often used by communities for boating, swimming, and fishing. In addition to canoes and kayaks, impoundments are sometimes accessible to motorized boats. Out of the 801 impoundments in the watershed, 68 (8.5%) are stocked with freshwater fish. Additionally, the flat water of impoundments makes them popular swimming places for people of all ages. The recreational opportunities on an impoundment will vary based on size and public access. Some have boat ramps and docks while those used for water supply often have restricted access.
Size of reservoirs within Narragansett Bay and coastal watersheds. A dam in the middle of a forest may have a different level of attachment than one in the middle of town
Reservoirs that are stocked with fish within Narragansett Bay and coastal watersheds. A dam in the middle of a forest may have a different level of attachment than one in the middle of town
When making a decision about the future of a dam, there is a trade-off between prioritizing flowing river recreation and prioritizing recreation on the flat water of an impoundment. However, recreation may be compatible with habitat restoration; see the Case Studies section to explore some of the alternatives that can be used to preserve an impoundment while improving habitat connectivity and fish passage.
1.5
Fish Passage + Ecosystem Impacts
River systems are dramatically altered by the construction of a dam, which often has a lasting impact on interspecies relationships and overall habitat connectivity. More than just flowing water, a river transports fish, sediment, and aquatic organisms between its headwaters (the farthest upstream point of a river or stream) to the mouth (where the river discharges into coastal waters), sustaining healthy ecosystems along the way. Dams disrupt the system by acting as barriers that disconnect upstream and downstream river lengths as well as the connection between rivers and oceans, effectively fragmenting multiple ecosystems18.
River Flow and Ecosystem Dynamics
Before European settlement, beaver dams and natural ponds were common in the smaller streams of the Narragansett Bay watershed. However, these beaver dams did not generate changes as extensive as those associated with human-constructed dams in the watershed. Beaver dams are relatively small, highly porous, and often seasonal or temporary (ephemeral). In contrast, dams constructed for industry and power generation were designed to be permanent and impervious, creating large-scale shifts in the flow and ecology of rivers in the region. Dams effectively transform portions of a river ecosystem into a lake ecosystem. While different aquatic and terrestrial species thrive in these distinct habitats, both rivers and impoundments can provide critical wetland habitat. These wetlands may serve as travel corridors; nesting, feeding, resting, nursery, and brood-rearing sites; and drinking water sources and cover for a variety of wildlife. They may also provide seasonal breeding, migratory, and overwintering habitat for birds19.
Free-flowing reaches of rivers and streams transport wood, rocks, and other natural debris downstream, where these materials accumulate to create characteristic riffles (shallow rocky areas), pools, and meanders. These habitat features act as shelter for prey species and help to support cold-water fish species such as brook trout, fallfish, blacknose dace, and longnose dace. Free-flowing rivers also support a unique macroinvertebrate fauna of mayflies, stoneflies, caddisflies, midges, craneflies, blackflies, dragonflies and damselflies, crayfish, and mollusks, which feed the aforementioned fish and form the base of the food chain in the freshwater aquatic system. In Rhode Island, Eastern brook trout are listed as a Species of Greatest Conservation Need due to habitat loss, water pollution, climate change, and the presence of dams that disrupt the cold, clear water flows they require. Similarly, several species of freshwater mussels are considered sensitive species because of degraded water quality and the fragmentation of river habitats.
Cold water streams supporting fish habitat. A dam in the middle of a forest may have a different level of attachment than one in the middle of town
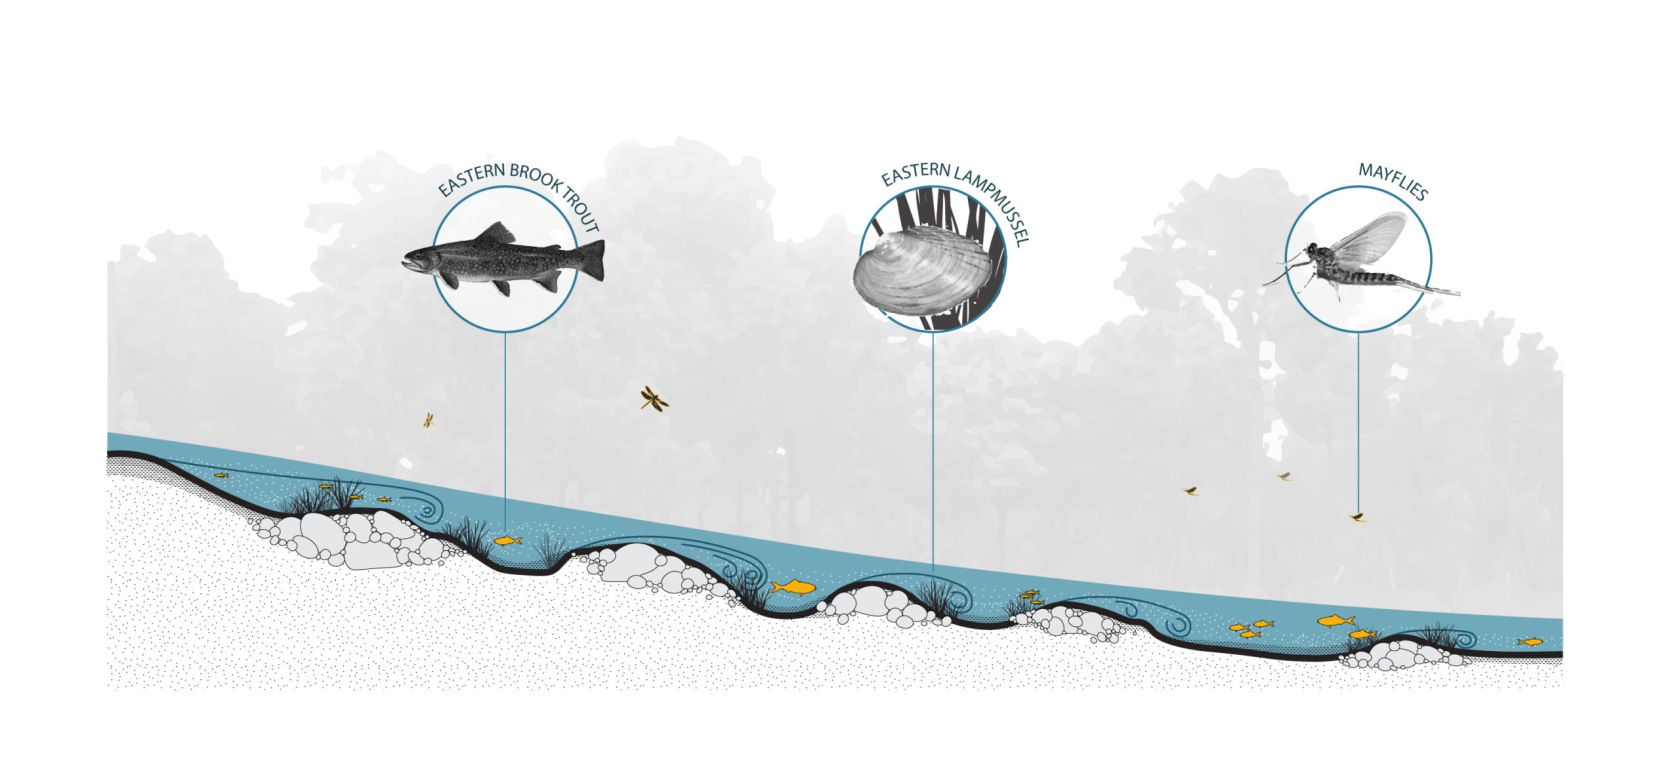
Diagrammatic section of free-flowing river
During high flow events, free-flowing rivers will overflow into floodplains, where water is slowed and spread out, mitigating high velocity flows and flood damage to human communities downstream. At the same time, significant sediment is transported downstream and throughout the floodplains, delivering nutrients and sediment to estuaries, marshes, and wetlands to support healthy wetland functioning. In some cases, nutrients trapped behind a dam can cause eutrophication and harmful algal blooms.
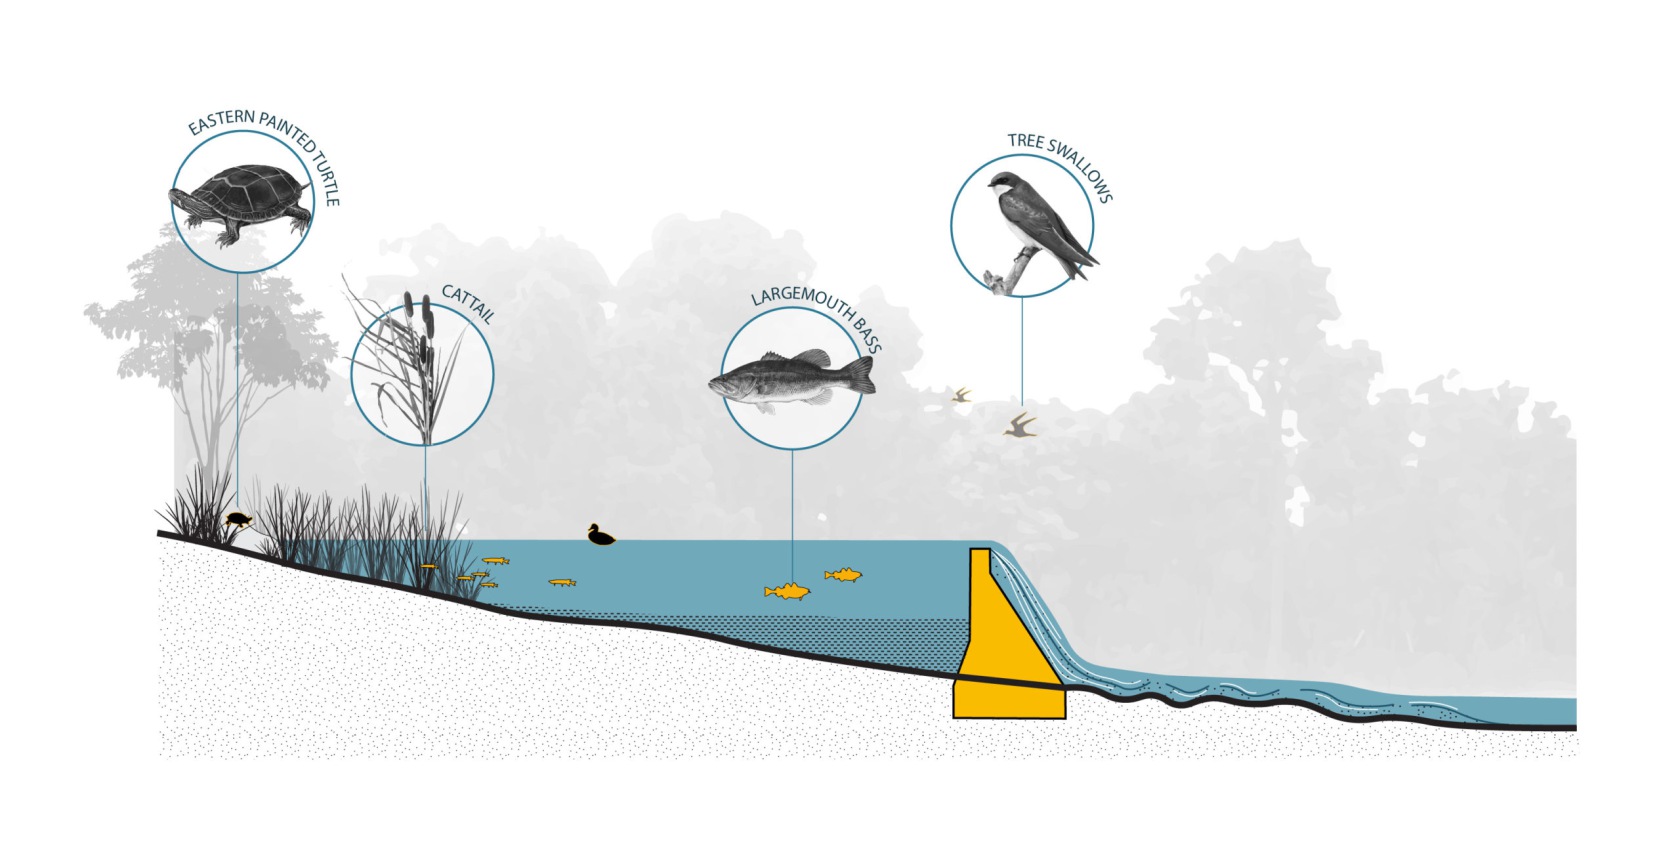
When dams are constructed, the river habitat above the dam is transformed into a lake habitat with warmer temperatures, slow moving water, and lower levels of dissolved oxygen, making the area uninhabitable for cold-water species but newly inhabitable for warm-water species such as non-native large and smallmouth bass, bluegill, and chain pickerel. These are species that are commonly found in lake and pond habitats throughout the region. Within these impoundments, wetlands previously located along the riverbanks, in the floodplains, and underneath the impounded area are pushed out to the shoreline or survive in shallow areas. These surviving wetlands are critical spawning and nursery habitat for a number of fish species. In addition, turtles, amphibians, and fish feed on the abundant invertebrate species that are found among aquatic plants. When a dam is removed, an impoundment that was formerly wetland will usually convert to a floodplain wetland—also an ecologically significant habitat. In some cases, rare and endangered species can be found in the novel lake ecosystems created by the impoundment, and additional studies are required to understand the impact of removing or preserving a dam.
When a river is dammed, the river below the dam no longer receives an input of wood, rocks, debris, and sediment to create critical habitat features, and begins to behave more like a chute with reduced habitat diversity. Losing access to floodplains and the sediment transport that builds and maintains floodplains and wetlands, such rivers also have higher velocity flows and, as a result, can be more damaging during large storms. Dams may also reduce genetic diversity within an ecosystem by separating resident fish populations, freshwater mussels, and other wildlife from their natural habitat and range, reducing their ability to reproduce and ultimately reducing their overall population. When free-flowing systems are dammed, there may be an influx of non-native species, which shifts predator-prey dynamics. While dams often have a negative impact on habitat connectivity and species diversity, there have been isolated situations in which dams have prevented the spread of invasive species or disease from one population to another.20
Miles of upstream river and stream opened to passage after dam removal.A dam in the middle of a forest may have a different level of attachment than one in the middle of town
Migratory Fish Passage
Dams disrupt the migration and spawning of fish, which travel through waterways at different stages in their lives. Anadromous fish such as salmon, American shad, and river herring live in the ocean and travel back to freshwater every spring to spawn. Using the earth’s magnetic field as a guide, they often return to the river where they were born. Once they find their specific river, they use odor to locate their home stream. If unable to reach this stream, some, rather than spawn in a new location, will continue searching until they have depleted all their energy and die in the process. American eel are catadromous; they spawn in the Sargasso Sea and the young migrate into the river networks to feed and mature, often remaining for five to ten or more years in freshwater ecosystems before migrating back to the Sargasso Sea to reproduce and then die.
The migration of fish is not only critical for the survival of their species but also contributes to the health of river and ocean ecosystems. Fish like river herring that reproduce in rivers provide the base of the food chain in the ocean, supporting species like tuna, striped bass, sea birds, seals, and whales. When they return to their rivers, they carry nutrients from the ocean into the river ecosystem and feed birds, mammals, and other wildlife, supporting a healthy inland food chain. Disconnecting the two ecosystems impacts the fish, mammal, and bird populations in both. In addition, it damages recreational and subsistence fishing in the Atlantic Ocean.
Historically, the river systems and coastal ponds that drain into Narragansett Bay and Block Island Sound supported the migration of millions of river herring, Atlantic salmon, shad, and American eels. Within a few hundred years after the arrival of European Colonists and the widespread construction of dams, these species had nearly disappeared21. Populations of blueback herring, alewife, and American shad in the northeastern United States are at less than 1%, 2%, and 3% of historic populations, respectively22. Rhode Island’s once lucrative Atlantic salmon fishery collapsed in 1870, and the river herring fishery was significantly depleted by 1930.
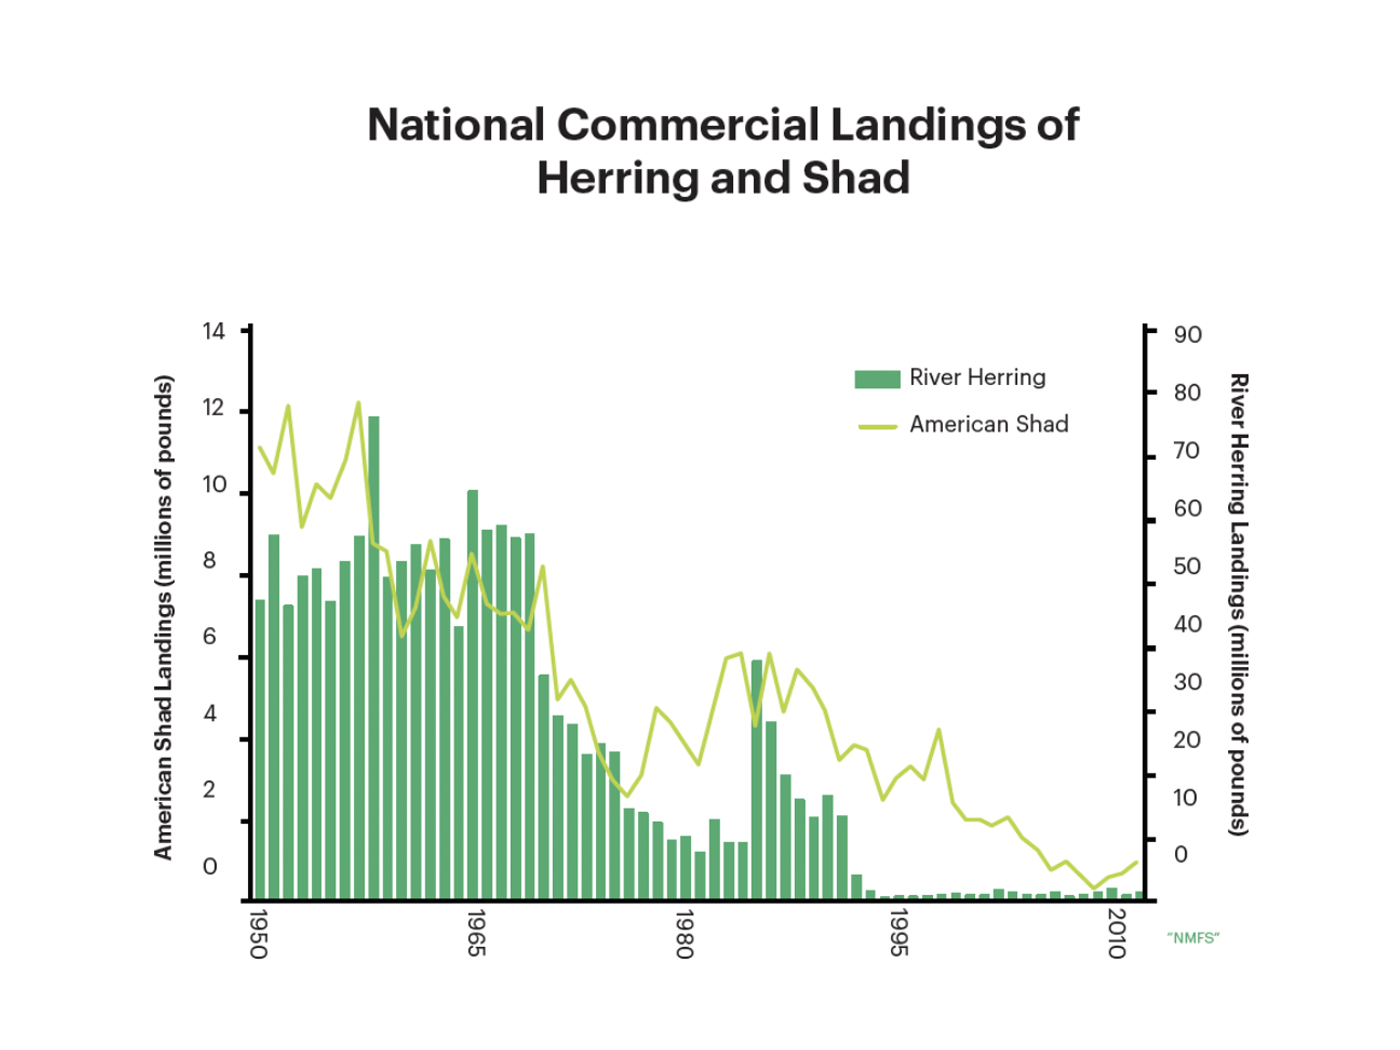
National commercial landings of herring and shad
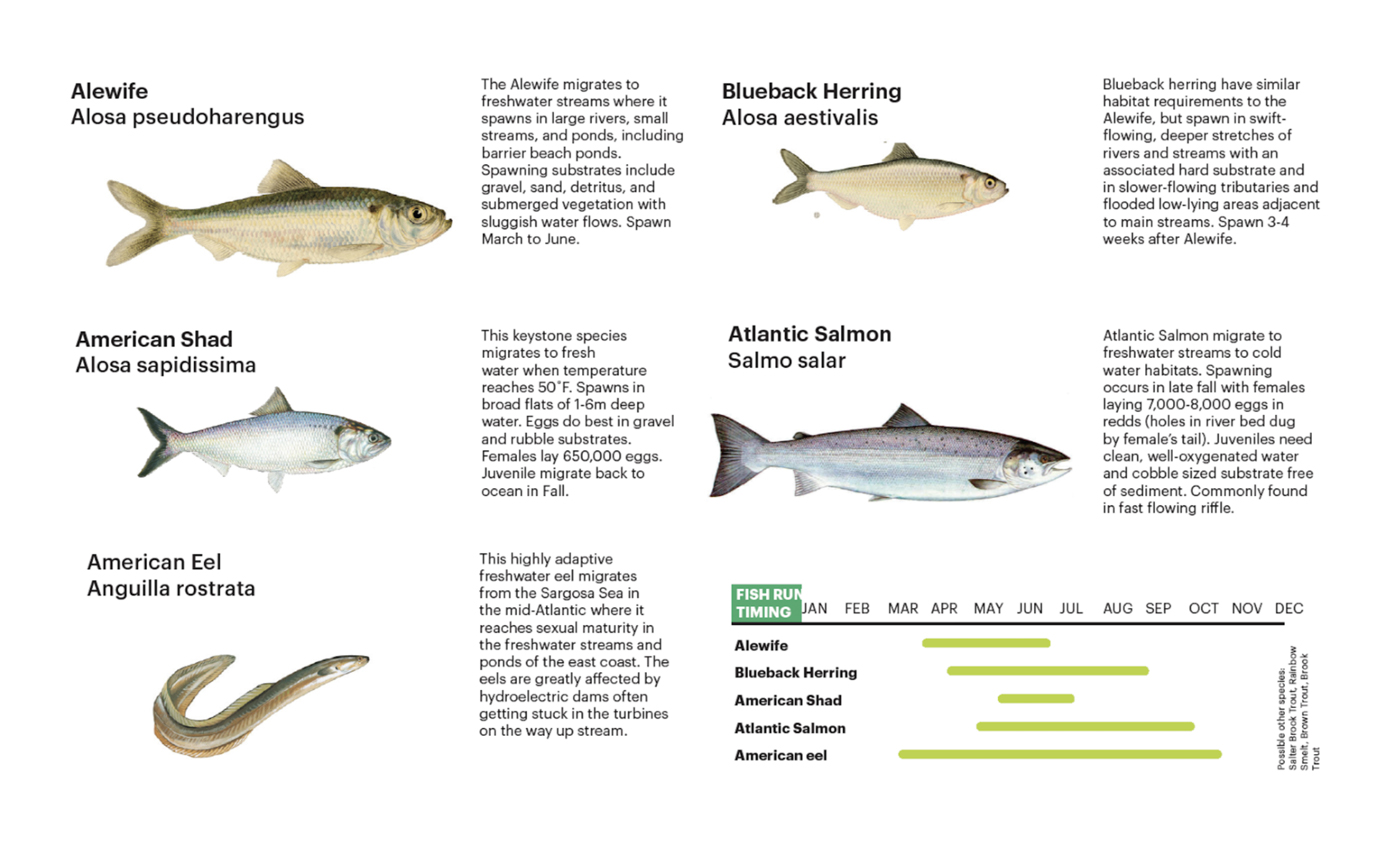
Anadromous fish found within the Narragansett Bay
Due to the importance of migrating fish species to the coastal rivers of Narragansett Bay, when trying to understand the impact of a dam, it is important to consider the location of the dam within the watershed. Head-of-tide dams are the first dams on a river system. If these dams do not allow for fish passage, the whole river system is impassable to migratory fish, greatly diminishing their spawning habitat and ability to reproduce. Dams located on the main stem of a river system are particularly disruptive to fish migration since they cut off large portions of the upstream watershed. When fish are stopped or delayed by a dam, even if the dam allows for some fish passage, they become easy prey and may experience significant population decline while predator species flourish.
Anadromous fish passage at head of tide dams (dams located at the farthest point upstream where a river is affected by tidal fluctuations) within Narragansett Bay and coastal watersheds. A dam in the middle of a forest may have a different level of attachment than one in the middle of town
In cases where dams have been removed along rivers in New England, some species of migratory fish have quickly returned, sometimes to rivers where they have not been seen for a century of more. In areas where dam removal is not possible, fishways may be an option to improve fish passage. See the Case Studies for more information about the various fishway alternatives to improve fish passage. A full ecological assessment is needed as part of any dam decision-making to evaluate the current wildlife and wetland habitats and to understand how they will be affected by the scenarios being considered.
Dams with fish passage modifications. A dam in the middle of a forest may have a different level of attachment than one in the middle of town
For dams not connected to the coastal system, removal also means improving connectivity and protecting/restoring coldwater fishery resources that are threatened by warming temperatures due to climate change.
1.6
Water Quality + Sediment
Dams alter the flow of a river, which can change many aspects of water quality23. Dams can increase river temperatures by creating stagnant impoundments with large surface areas that absorb sunlight. Surface conditions may become unsuitable for many cold-water fish species that once thrived in free-flowing rivers. Warmer waters experience accelerated evaporation and have a lower capacity to hold oxygen, which can negatively impact fish and aquatic life. Dissolved oxygen levels are also impacted when a dam changes the flow regime from a fast-moving river to a dammed impoundment with still water. While fast-moving water is well aerated, still water is warmed by sun exposure, contributing to increased oxygen saturation. In large, deep impoundments, the release of cold bottom waters can support an artificial cold-water fishery for trout or herring downstream of the dam; however, the majority of impoundments in the study area are shallow, and the water is released from the top of the impoundment where the water is warmer.
Map of impaired waters in the watershed. A dam in the middle of a forest may have a different level of attachment than one in the middle of town
Excess nutrients, such as nitrogen and phosphorus, can create undesirable conditions in impoundments and coastal waters. High concentrations of these nutrients can trigger the growth of aquatic plants and algae, which consume oxygen. At worst, excess nutrients and low oxygen conditions can cause large-scale fish kills within lakes and bays. Some blooms, like those produced by cyanobacteria, or blue-green algae, are especially worrisome as they may be toxic to humans and animals.
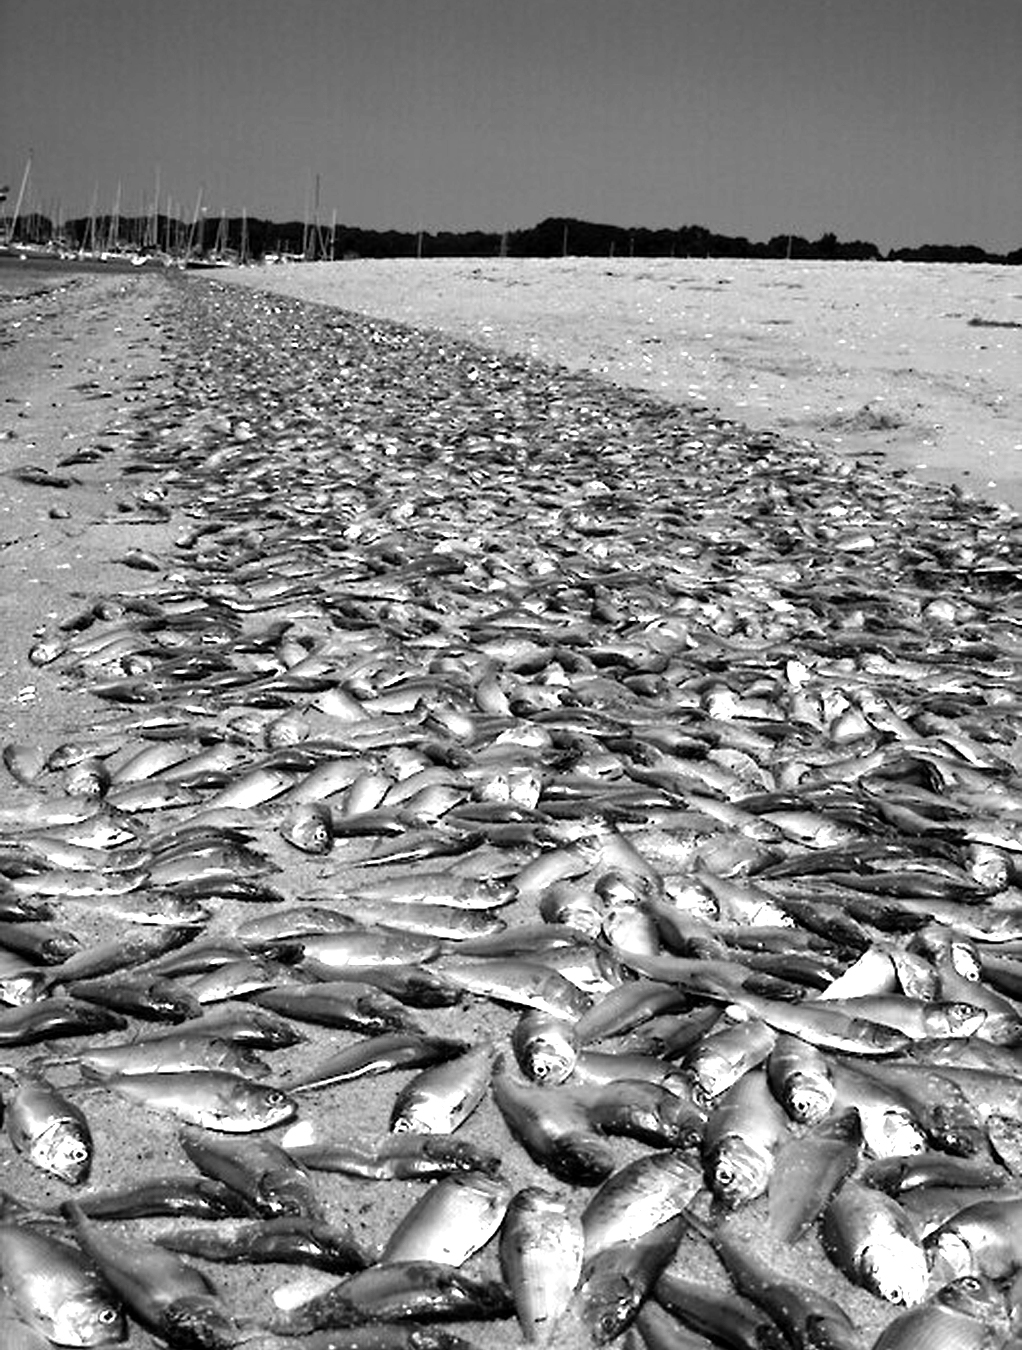
Juvenile menhaden fish kill, Greenwich Bay RI August 20, 2003
Source: Tom Ardito, NBEP (ian.umces.edu/media-library)
Scientists have hypothesized that dams whose impoundments are located within headwater tributaries may actually promote natural removal processes or storage of nitrogen or phosphorus, and so improve water quality in downstream estuaries24. The riparian wetlands around an impoundment also may be protecting excess nutrients from entering rivers. Research is underway to determine if there may be cases where nutrient retention is an unexpected tradeoff for dam removal.
Sediment
Rivers naturally transport sediment downstream; however, when dams are built, most sediments are trapped and settle behind the dam. There are two important concerns regarding sediment: accumulation and contamination25.
Accumulation: Unless the impoundment is dredged, sediment will accumulate over time. Generally, there will be more accumulated sediment in watersheds with agricultural and urban land uses that direct sediment-laden stormwater into the river. Sediment accumulation reduces the impoundment’s water storage capacity, which can lead to flooding during high flow conditions and storms. As impoundments behind dams fill with sediment, the water becomes increasingly shallower, warmer, and lower in dissolved oxygen. Additionally, trapped sediment can cover the habitat of bottom-dwelling species. The accumulation of sediment behind a dam can also cause the stream below the dam to be sediment starved, often resulting in erosion.
Contamination: Since many dams within the Narragansett Bay and associated coastal watersheds date back to the Industrial Revolution, a wide variety of pollutant materials, including nutrients, metals, hydrocarbons, and exotic organic compounds, may be present in the sediments behind a dam. Dams may prevent contaminated sediment from traveling downstream and further dispersing these pollutants, a situation that would create expenses and complications related to removal.
Sediment management is an important consideration when looking at scenarios for the future of a dam. It determines the design, permitting, and cost of the project. It is incredibly nuanced, and every project is different. Sediment behind a dam—contaminated or not—will often make dam removals more complex and costly. When a dam is removed, sediment may be released downstream, which increases turbidity, impacts downstream wetland habitats, and may release contaminants. However, in many cases, the area downstream of the dam may be considered “sediment starved” due to the dam being in place, and replenishing sediment can be beneficial for the ecosystem. The quantity of sediment expected to move downstream following a dam removal should be considered in comparison to the size of the river, the extent of the watershed, and the typical sediment budget for the system. In the case of a large river, the sediment released during a dam removal may be a very small percentage of the river’s annual sediment budget, and in some cases may be comparable to the amount of sediment typically moved during a large storm.
There are a range of sediment management alternatives to consider if the decision is made to remove a dam26:
- Sediment removal and disposal offsite.
- On-site redistribution and revegetation of sediment so that it is no longer mobile.
- Allowing the sediment to flow downstream and be redistributed by the river.
- Capping, or in-situ remediation, if the sediment is highly contaminated.
- Controlled/managed drawdown of the impoundment (sometimes over multiple years) to allow sediments to stabilize and revegetate in place.
- Removal of isolated contaminants while allowing the majority of sediments to stabilize in place or move downstream.
- A combination of the above alternatives.
The decision about how to manage the sediment begins with a regulatory review that considers current and past upstream land uses, sediment testing for contamination, and sediment probing, which estimates the total volume of sediment in the impoundment. This review can help to determine the volume of sediment likely to mobilize following dam removal. It is important to understand that not all sediment within the impoundment will flow downstream at once, if at all. Sediments in the main channel will start flowing downstream immediately, while those distributed to the floodplain will be mobilized only during large storms and likely over many year. When considering the management of contaminated sediments, it is also important to consider contamination levels in the impoundment relative to upstream and downstream areas and the context of the watershed. For example, in a heavily urbanized watershed, contaminants are likely to be present not only in the impoundment but also up and downstream.
In addition to depriving rivers of sediment, dams can also diminish sediment supplies in coastal ecosystems27. Sediment from rivers within the watershed help to nourish the beaches and salt marshes in the Narragansett Bay. Salt marshes within the bay are already heavily degraded and threatened and will be further impacted by sea level rise28. Because dams prevent the flow of sediment downstream to the bay, they effectively reduce the capacity of salt marshes to adapt to rising sea levels.
1.7
Cost + Funding
Dam removal, repairs, and/or modifications can be costly, and because every dam is different, there are many factors that can affect the cost and economic impact of a decision. Some economic factors to keep in mind when considering possible future dam scenarios include short-term cost, long-term cost, liability cost, and socioeconomic impacts.
When examining the cost of various scenarios, the short-term cost of the alternative is often the primary consideration. Short-term costs may span multiple phases, including public outreach and project feasibility; designing and permitting; implementation (dam repair, removal, or modification); and post-removal adaptive management and monitoring. The actual cost of implementation will vary depending on the size, location, and condition of the dam as well as its proximity to other infrastructure and utilities, the sediment management approach, the approach to controlling water during construction, and regional economic conditions.
It is also important to account for the long-term cost of dam maintenance and operation. Repairing or upgrading a dam may be less expensive than removal in the short term, but the cost of repairing and maintaining a dam will be an ongoing expense.
In addition to the direct economic impact of any modifications to the dam, there may be other societal economic impacts to consider. For example, if an impoundment is a significant tourist attraction and the local economy benefits from outdoor recreation, it will be important to consider the impact of various scenarios on local revenue. Furthermore, it will be critical to look at the potential impacts on surrounding property values. Evaluation of these benefits and impacts should include consideration of who benefits and who is impacted.
While dam modification alternatives such as nature-like fishways, by-pass channels, and technical fishways can be more costly in the long term than removal, they may allow for a community to find a compromise and balance the trade-offs in an otherwise controversial decision.
Funding
Dam projects often require a combination of different funding sources from state and federal agencies, nonprofit organizations, cities, towns, and private foundations. In some cases, there may be a greater likelihood of external funding if full removal is chosen, but each case is particular and the economic considerations need to be evaluated alongside other dimensions of the dam decision. Any available grants and loans will be specific to the stated purpose of the dam removal. For example, there may not be grants available for restoration of fish passage, but there could be funds available for watershed restoration, flood mitigation, or coastal and climate resilience, or vice versa. Typically, there is not significant funding available for ongoing costs associated with owning a dam, whether that be maintaining a fishway or conducting required inspections. Funding for repairs of a dam that is not high or significant hazard or in poor or unsafe condition can also be challenging to secure.
See the appendix 29 for a list of possible funding sources.
References & Additional Resources
- See, for example, arguments made by the group aiming to save the Natick Dam, https://www.savenatickdam.org/
- See, for example, Executive Office of Energy and Environmental Affairs. 2007. Dam Removal In Massachusetts: A Basic Guide for Project Proponents, Lindloff, Stephanie. 2000. Dam Removal: A Citizen’s Guide To Restoring Rivers. River Alliance of Wisconsin and Trout Unlimited and Bowman, M., Higgs, S., Maclin,E., McClain,S., Sicchio,M., Souers, A., Johnson, S., Graber, B. 2002. Exploring Dam Removal: A Decision- Making Guide. American Rivers and Trout Unlimited.
- Fox, C. A., F. J. Magilligan, and C. S. Sneddon. 2016. “You kill the dam, you are killing a part of me”: dam removal and the environmental politics of river restoration. Geoforum 70:93–104.
- Our methods were adapted from Gregory, R., Failing, L., Harstone, M., Long, G., McDaniels, T.L., & Ohlson, D.W. 2012. Structured Decision Making: A Practical Guide to Environmental Management Choices. Wiley-Blackwell, Chichester, U.K.
- Parent, Jason R., Arthur J. Gold, Emily Vogler, and Kelly Addy Lowder. 2024. “Guiding Decisions on the Future of Dams: A GIS Database Characterizing Ecological and Social Considerations of Dam Decisions.” Journal of Environmental Management 351 (February): 119683. https://doi.org/10.1016/j.jenvman.2023.119683.
- STATE OF RHODE ISLAND, Office of Energy Resources https://energy ri.gov/renewable-energy/hydro/learn-about-hydropower
- Assuming a 40% capacity factor. Because water flows are variable, hydropower systems don’t produce power at their maximum capacity all of the time),
- Kuffner, Alex. 2013 Developer seeks to use ancient technology to draw energy from Pawtuxet River. Providence Journal.
- Forbes Street Solar Project I. https://www.cme-energy.com/content/forbes-street-solar-project-i
- See, for example proposals by Turbulent. https://www.turbulent.be/
- American Society of Civil Engineers. Infrastructure Report Card 2021. https://infrastructurereportcard.org/cat-item/dams-infrastructure/
- MASS Department of Conservation & Recreation. https://www.mass.gov/service-details/dam-safety-inspection-requirements
- https://dem.ri.gov/environmental-protection-bureau/compliance-and-inspection/compliance-programs/dam-safety
- Department of Environmental Management: Office of Compliance and Inspection State Of Rhode Island. 2018. Annual Report To The Governor On The Activities Of The Dam Safety Program.
- Ibid.
- Ibid
- Department of Environmental Management: Office of Compliance and Inspection State Of Rhode Island. 2010. Annual Report To The Governor On The Activities Of The Dam Safety Program.
- Einhorn, Erin. 2020. Thousands fled for their lives when two Michigan dams collapsed. More disasters are coming, experts say. NBC NEWS.
- Association of State Dam Safety Officials. Understanding Dam Failures https://damsafety.org/dam-failures#Learning%20from%20the%20Past
- See, for example, McClain, Serena, Lindloff, Stephanie, Baer, Katherine. Dam Removal and Historic Preservation: Reconciling Dueling Objectives. American Rivers and the National Park Service. 2008.
- National Park Service. National Register of Historic Places. https://www.nps.gov/subjects/nationalregister/index.htm
- See, for example, McClain, Serena, Lindloff, Stephanie, Baer, Katherine. Dam Removal and Historic Preservation: Reconciling Dueling Objectives. American Rivers and the National Park Service. 2008.
- See the “Case Studies” chapter to explore some of these alternatives.
- For a more in depth discussion of the ecological impact of dams, see: Hart, D.D et al. 2002 .Dam Removal: Challenges and Opportunities for Ecological Research and River Restoration BioScience. 52 (8).
- Dam Removal and Wetland Regulations. Massachusetts Department of Environmental Protection. 2007
- Erkan, Dennis. Strategic Plan For The Restoration Of Anadromous Fish To Rhode Island Streams. Rhode Island Department of Environmental Management Division of Fish and Wildlife. 2002.
- See Barnett, Zanethia C., and Susan B. Adams. 2021. “Review of Dam Effects on Native and Invsive Crayfishes Illustrates Complex Choices for Conservation Planning.” Frontiers in Ecology and Evolution 8 (January): 621723. https://doi.org/10.3389/fevo.2020.621723. Or Rahel, Frank J. 2013. “Intentional Fragmentation as a Management Strategy in Aquatic Systems.” BioScience 63 (5): 362–72. https://doi.org/10.1525/bio.2013.63.5.9.
- Limburg, K. E. and J. R. Waldman. 2009. Dramatic declines in North Atlantic diadromous fishes. BioScience 59: 955–965. doi: https://doi.org/10.1525/bio.2009.59.11.7.
- For a more in depth discussion of the ecological impact of dams, see: Hart, D.D et al. 2002 .Dam Removal: Challenges and Opportunities for Ecological Research and River Restoration BioScience. 52 (8).
- Gold, Arthur, Kelly Addy, Alisa Morrison, and Marissa Simpson. 2016. “Will Dam Removal Increase Nitrogen Flux to Estuaries?” Water 8 (11): 522. https://doi.org/10.3390/w8110522.
- See: Snyder, N. P., Rubin, D. M., Alpers, C. N., Childs, J. R., Curtis, J. A., Flint, L. E., & Wright, S. A. (2004). Estimating accumulation rates and physical properties of sediment behind a dam: Englebright Lake, Yuba River, northern California. Water Resources Research, 40(11). and Evans, J. E. (2015). Contaminated Sediment and Dam Removals: Problem or Opportunity? Earth and Space Science News. Retrieved from https://eos.org/features/contaminated-sediment-and-damremovals- problem-or-opportunity-2
- Massachusetts Department of Environmental Protection. 2007. Dam Removal and Wetland Regulations.
- Crosby, Sarah C., Dov F. Sax, Megan E. Palmer, Harriet S. Booth, Linda A. Deegan, Mark D. Bertness, and Heather M. Leslie. 2016. “Salt Marsh Persistence Is Threatened by Predicted Sea-Level Rise.” Estuarine, Coastal and Shelf Science 181 (November): 93–99. https://doi.org/10.1016/j.ecss.2016.08.018.
- Roman, C.T. (2017). Watershed Counts 2017 Report: Climate Change in Narragansett Bay: Rising Seas and Salt Marshes. Ed. Nicole E. Rohr. University of Rhode Island and Narragansett Bay Estuary Program. R.I. 8 pp.
- Abbott KM, Zaidel PA, Roy AH, Houle KM, Nislow KH (2022) Investigating impacts of small dams and dam removal on dissolved oxygen in streams. PLoS ONE 17(11): e0277647. https://doi.org/10.1371/journal.pone.0277647
- Zaidel, Peter A., Allison H. Roy, Kristopher M. Houle, Beth Lambert, Benjamin H. Letcher, Keith H. Nislow, and Christopher Smith. 2021. “Impacts of Small Dams on Stream Temperature.” Ecological Indicators 120 (January): 106878. https://doi.org/10.1016/j.ecolind.2020.106878.
- Parent, Jason R., Arthur J. Gold, Emily Vogler, and Kelly Addy Lowder. 2024. “Guiding Decisions on the Future of Dams: A GIS Database Characterizing Ecological and Social Considerations of Dam Decisions.” Journal of Environmental Management 351 (February): 119683. https://doi.org/10.1016/j.jenvman.2023.119683.